Dust measurement through the whole working day
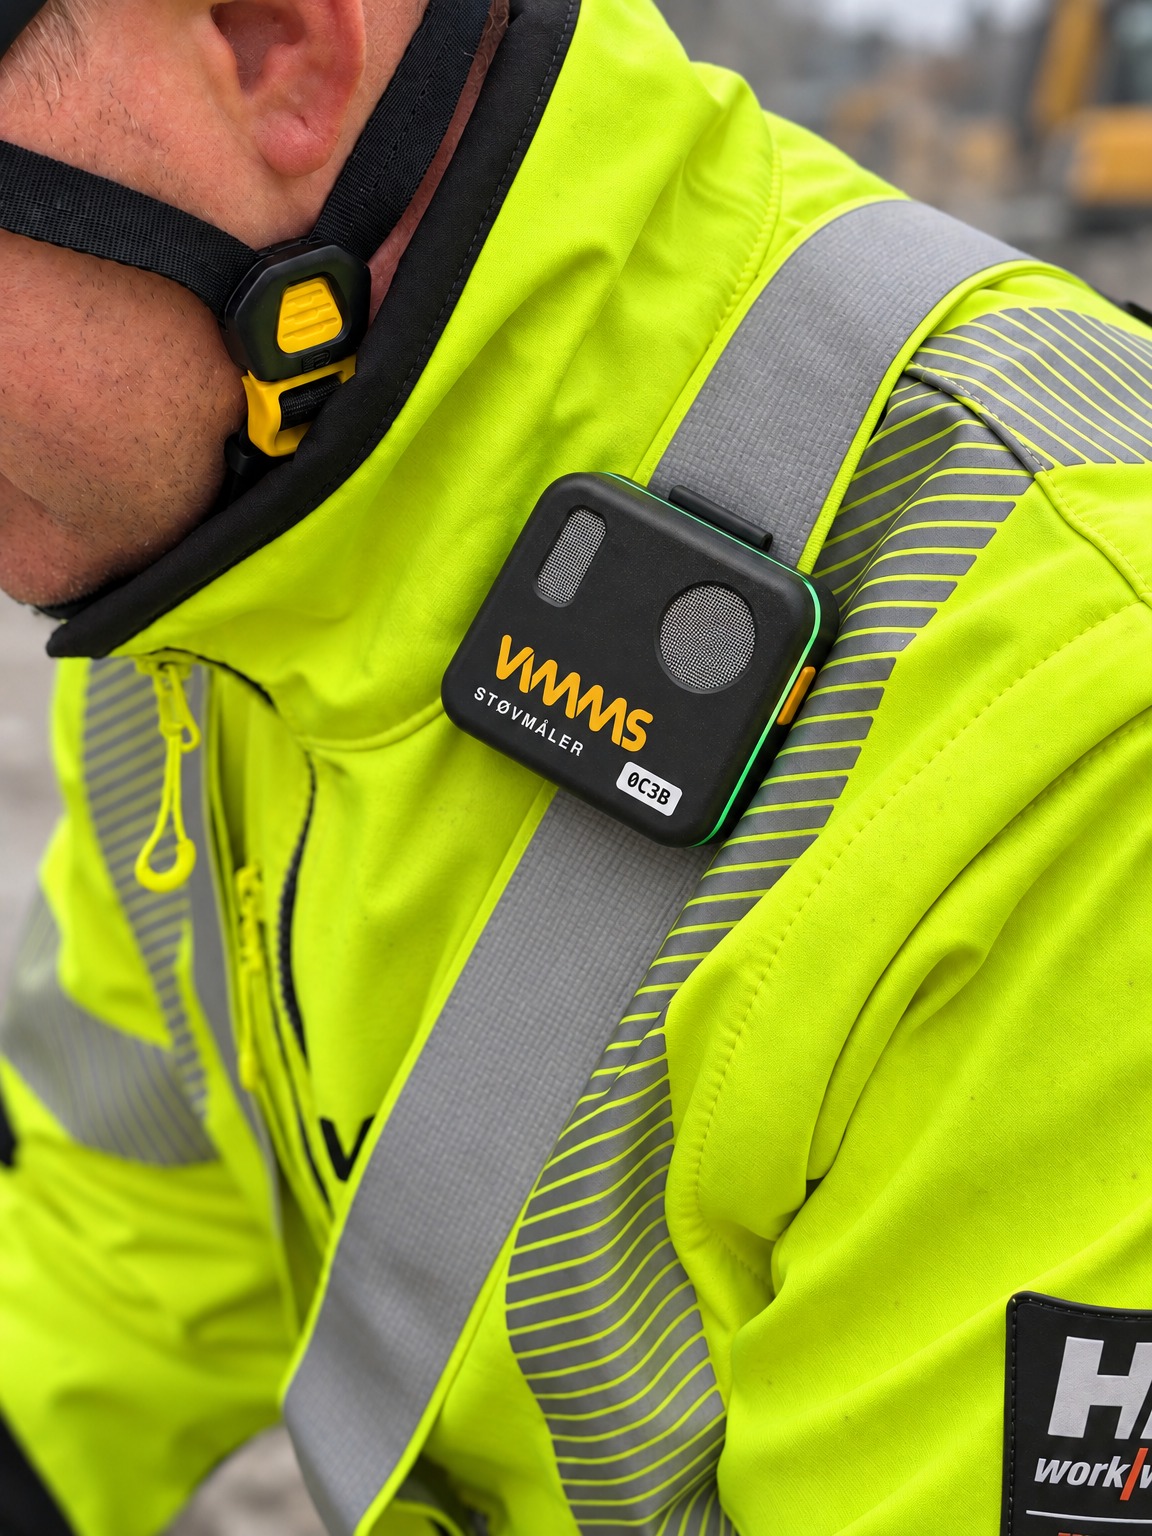
A wearable dust monitor that is clipped to the work clothes. You follow the readings on the phone and see them on a map in the dashboard.
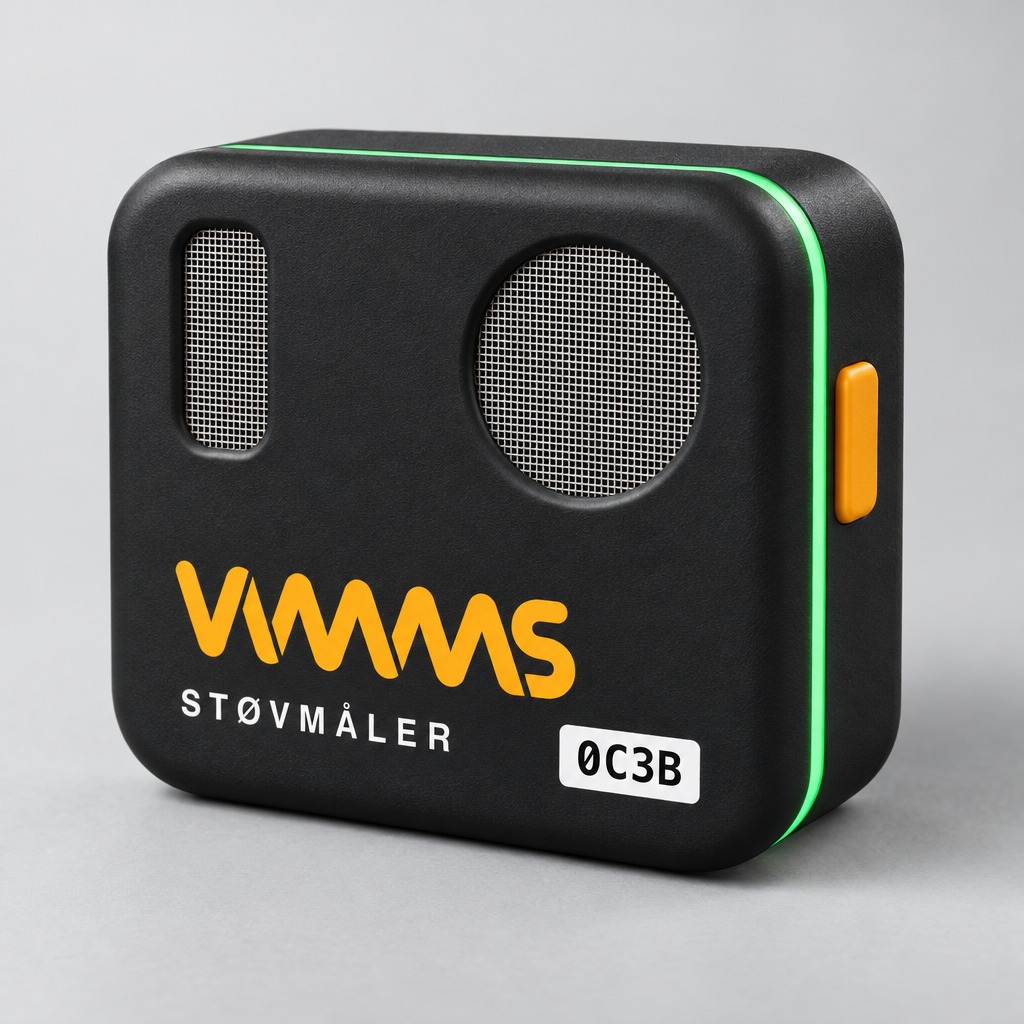
Made for continuous dust mapping
VIMMS AS in Mandal is developing a wearable dust monitor for workplaces where workers are exposed to dust. It is made to be used in everyday work, day after day, instead of on a few separate measurement days.
- Measures every second through the whole working day, so short, dusty tasks show up.
- Simple enough for the workers to use themselves: clip it to the jacket and start from the app.
- The readings reach the dashboard by themselves. Nobody has to collect data or send samples for analysis.
- With several monitors and weeks of data you see which tasks and places give the most dust, and whether measures have an effect.
We are testing a prototype today and are now developing the product version.
See where the dust really is
Every reading has a time and a place. We group them into hexagons on the map, and colour and height show the dust level. Drag to rotate, play the day and watch the exposure build up.
It needs WebGL and an internet connection to load the 3D engine.
One working day, 24 000 readings
One worker wearing the monitor from 07:00. The drill rig and the crusher stand out clearly.
- Time
- –
- Peak so far
- –
- Average so far
- –
- Time at low level
- –
- Readings
- –
High resolutionEach hexagon gathers the readings within about 1.5 metres.
Height and colourBoth show the highest dust level in the hexagon.
From the breathing zone to the report
Monitor, app, cloud and dashboard work as one. The data flows by itself, so nobody has to move files or copy numbers.
Monitor
Logs dust every second, with or without the phone nearby.
WirelessApp
Live values, alerts and GPS position for every reading.
4G / 5G / Wi-FiCloud
Stores, processes and protects the data with access control.
HTTPSDashboard
Live map, analysis, 3D view and export in the browser.
BrowserReport
Assessed against the limit values, with maps and clear conclusions.
AutomaticWant to test the monitor before launch?
We are happy to show the monitor and the system. We are looking for companies that want to try it in their own work.